The Analytics Layer NetSuite Was Missing
Most NetSuite users are still running margin, channel, and reconciliation reports out of saved searches and exported CSVs. GC Analytics replaces that with live P&L visibility by SKU and channel, order reconciliation, and SKU velocity — purpose-built for how teams actually use NetSuite.
Connects with the systems you already run
Built by a NetSuite developer, for teams that outgrew saved searches
GC Analytics was built after years of implementing NetSuite across industries — and watching finance teams export the same saved searches every month to answer the same questions. Channel margin, SKU velocity, order reconciliation. It's all here, live, without a spreadsheet or an overnight ETL.
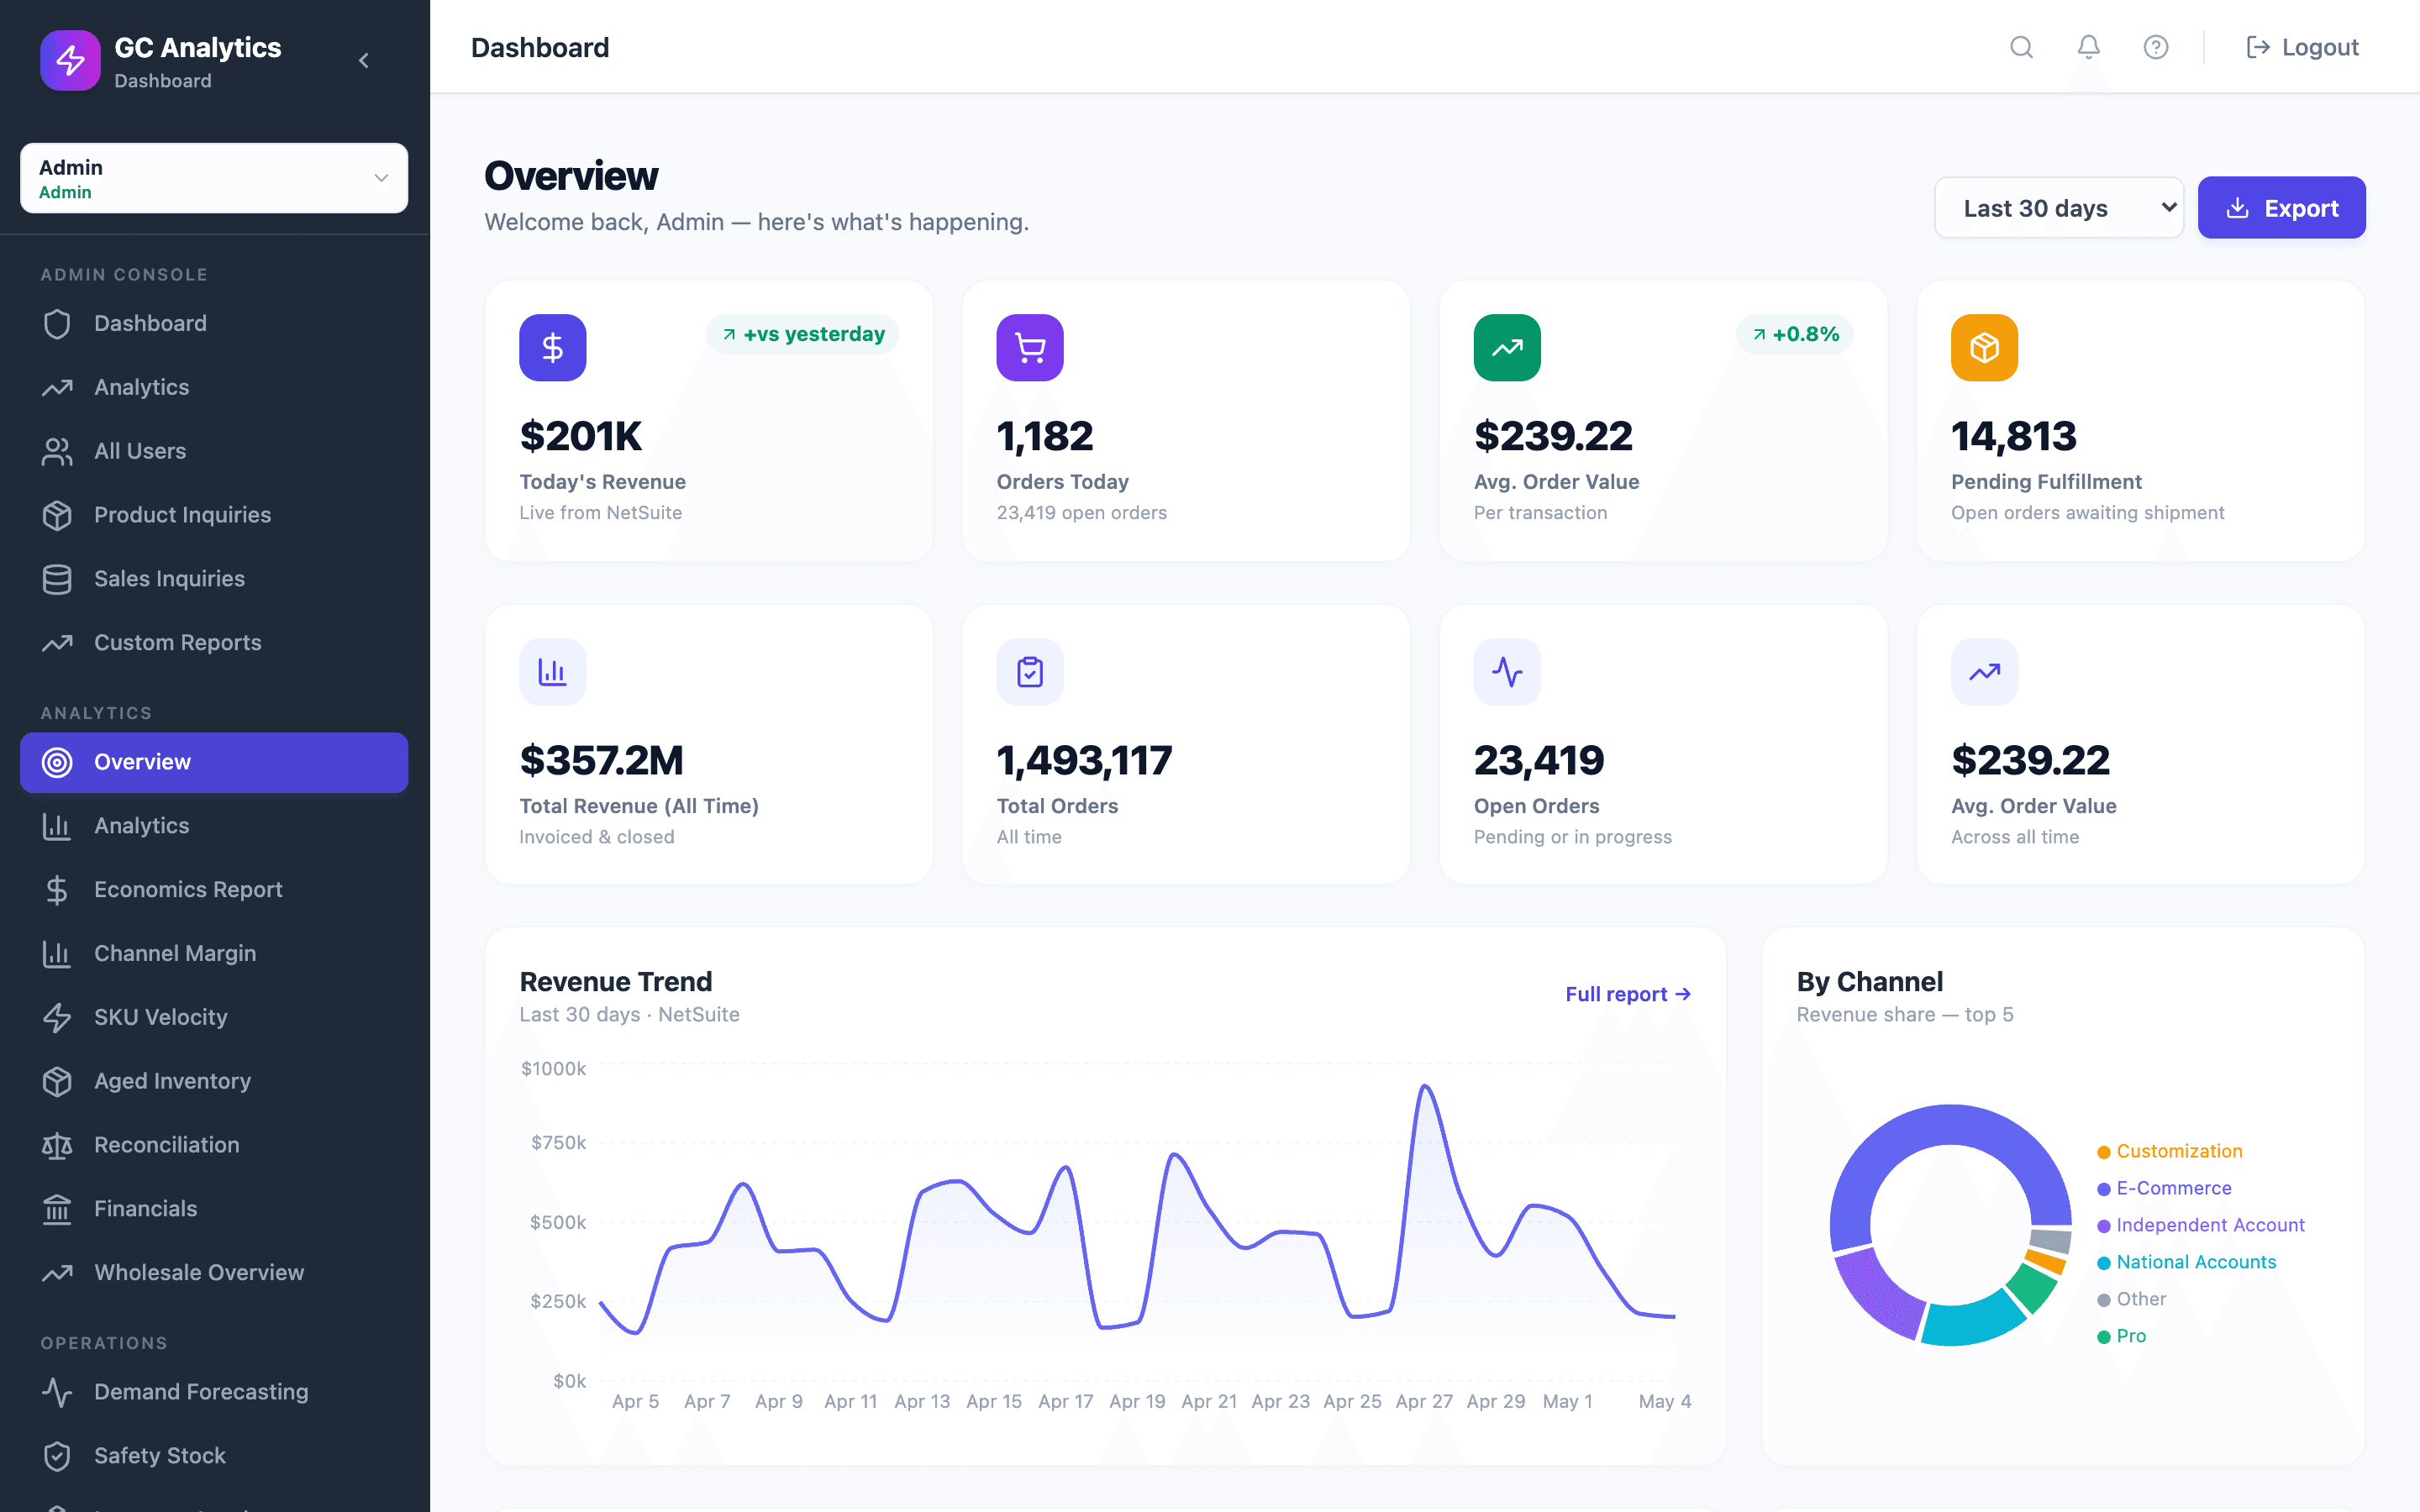
Stop refreshing saved searches. See today's numbers the moment you open a tab.
Revenue, orders, AOV, and pending fulfillment pulled live from NetSuite — no saved search refresh, no CSV export, no waiting until tomorrow. Role-based views mean finance, ops, and sales each see what they need without logging into the ERP.
- Real-time KPIs synced live from NetSuite
- Revenue trend, channel mix, and fulfillment status at a glance
- Role-based views for finance, ops, and sales
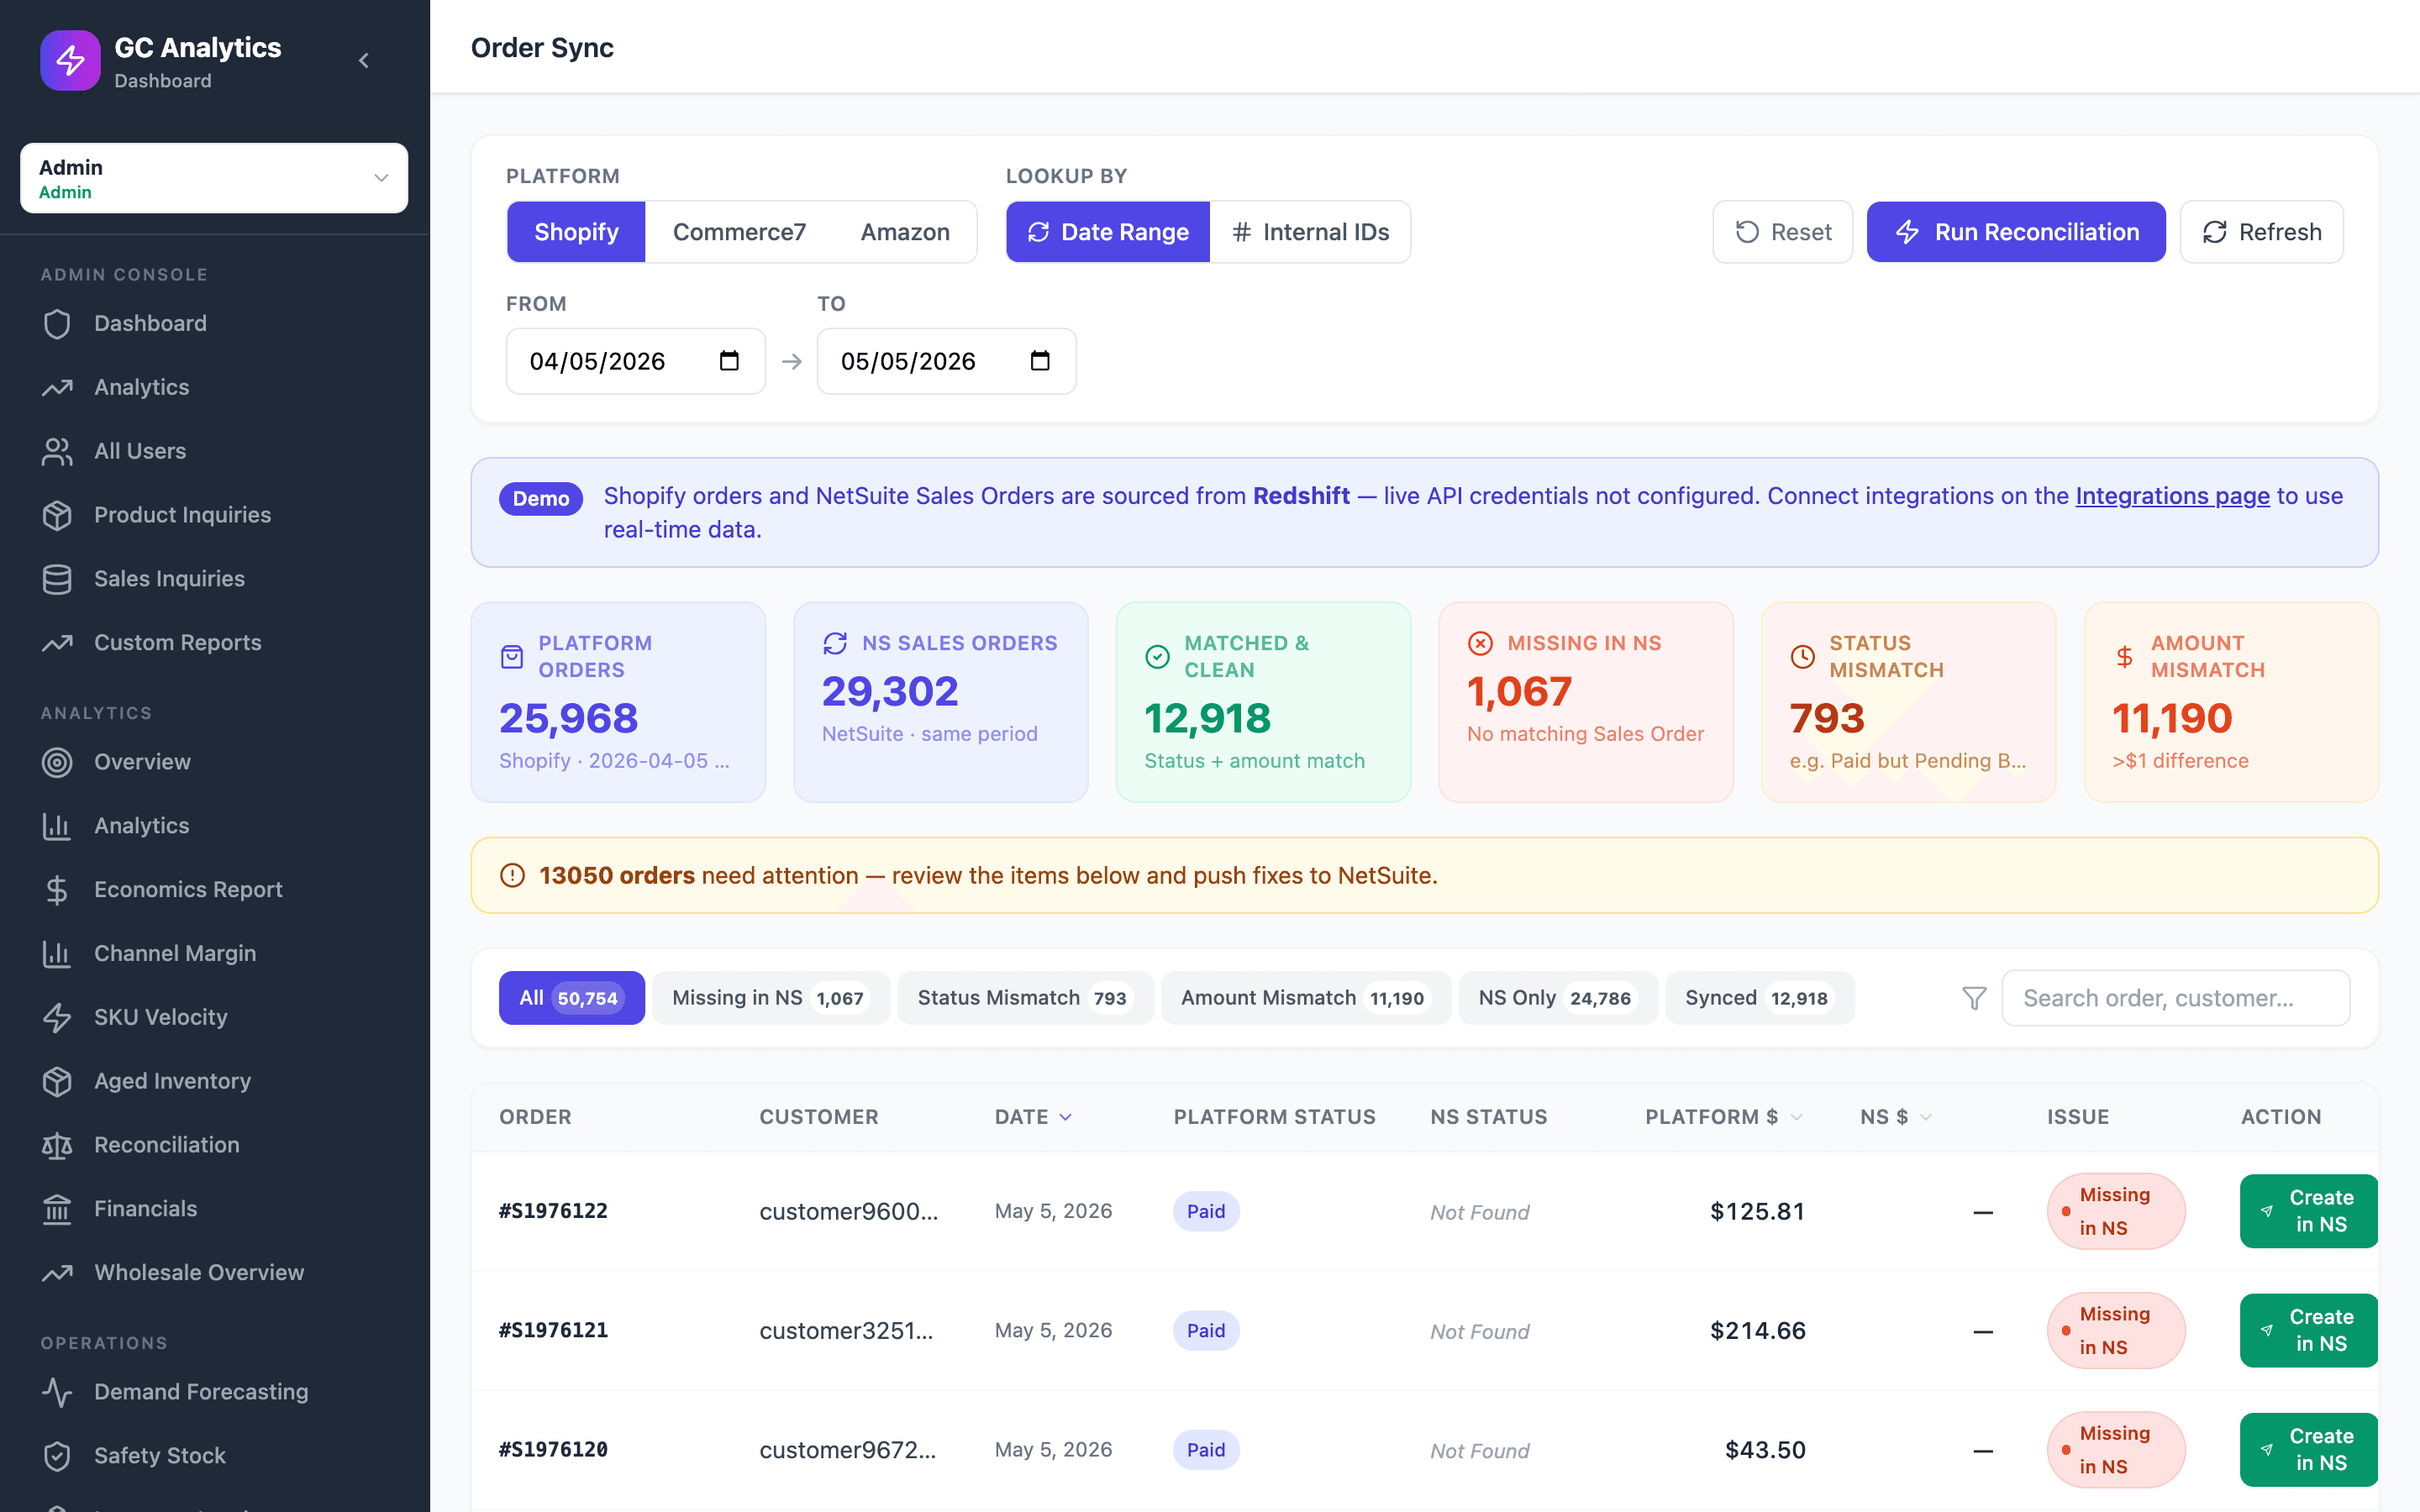
Catch missing and mismatched orders before your customers do
Every order from every channel cross-referenced against NetSuite automatically. Missing orders, status mismatches, and amount differences surfaced by type — and fixable in one click without touching a script or opening a ticket.
- Surface orders missing from your ERP, status mismatches, and amount differences
- Filter by date range, sales channel, or specific order IDs
- One-click Create in ERP remediation, no scripting required
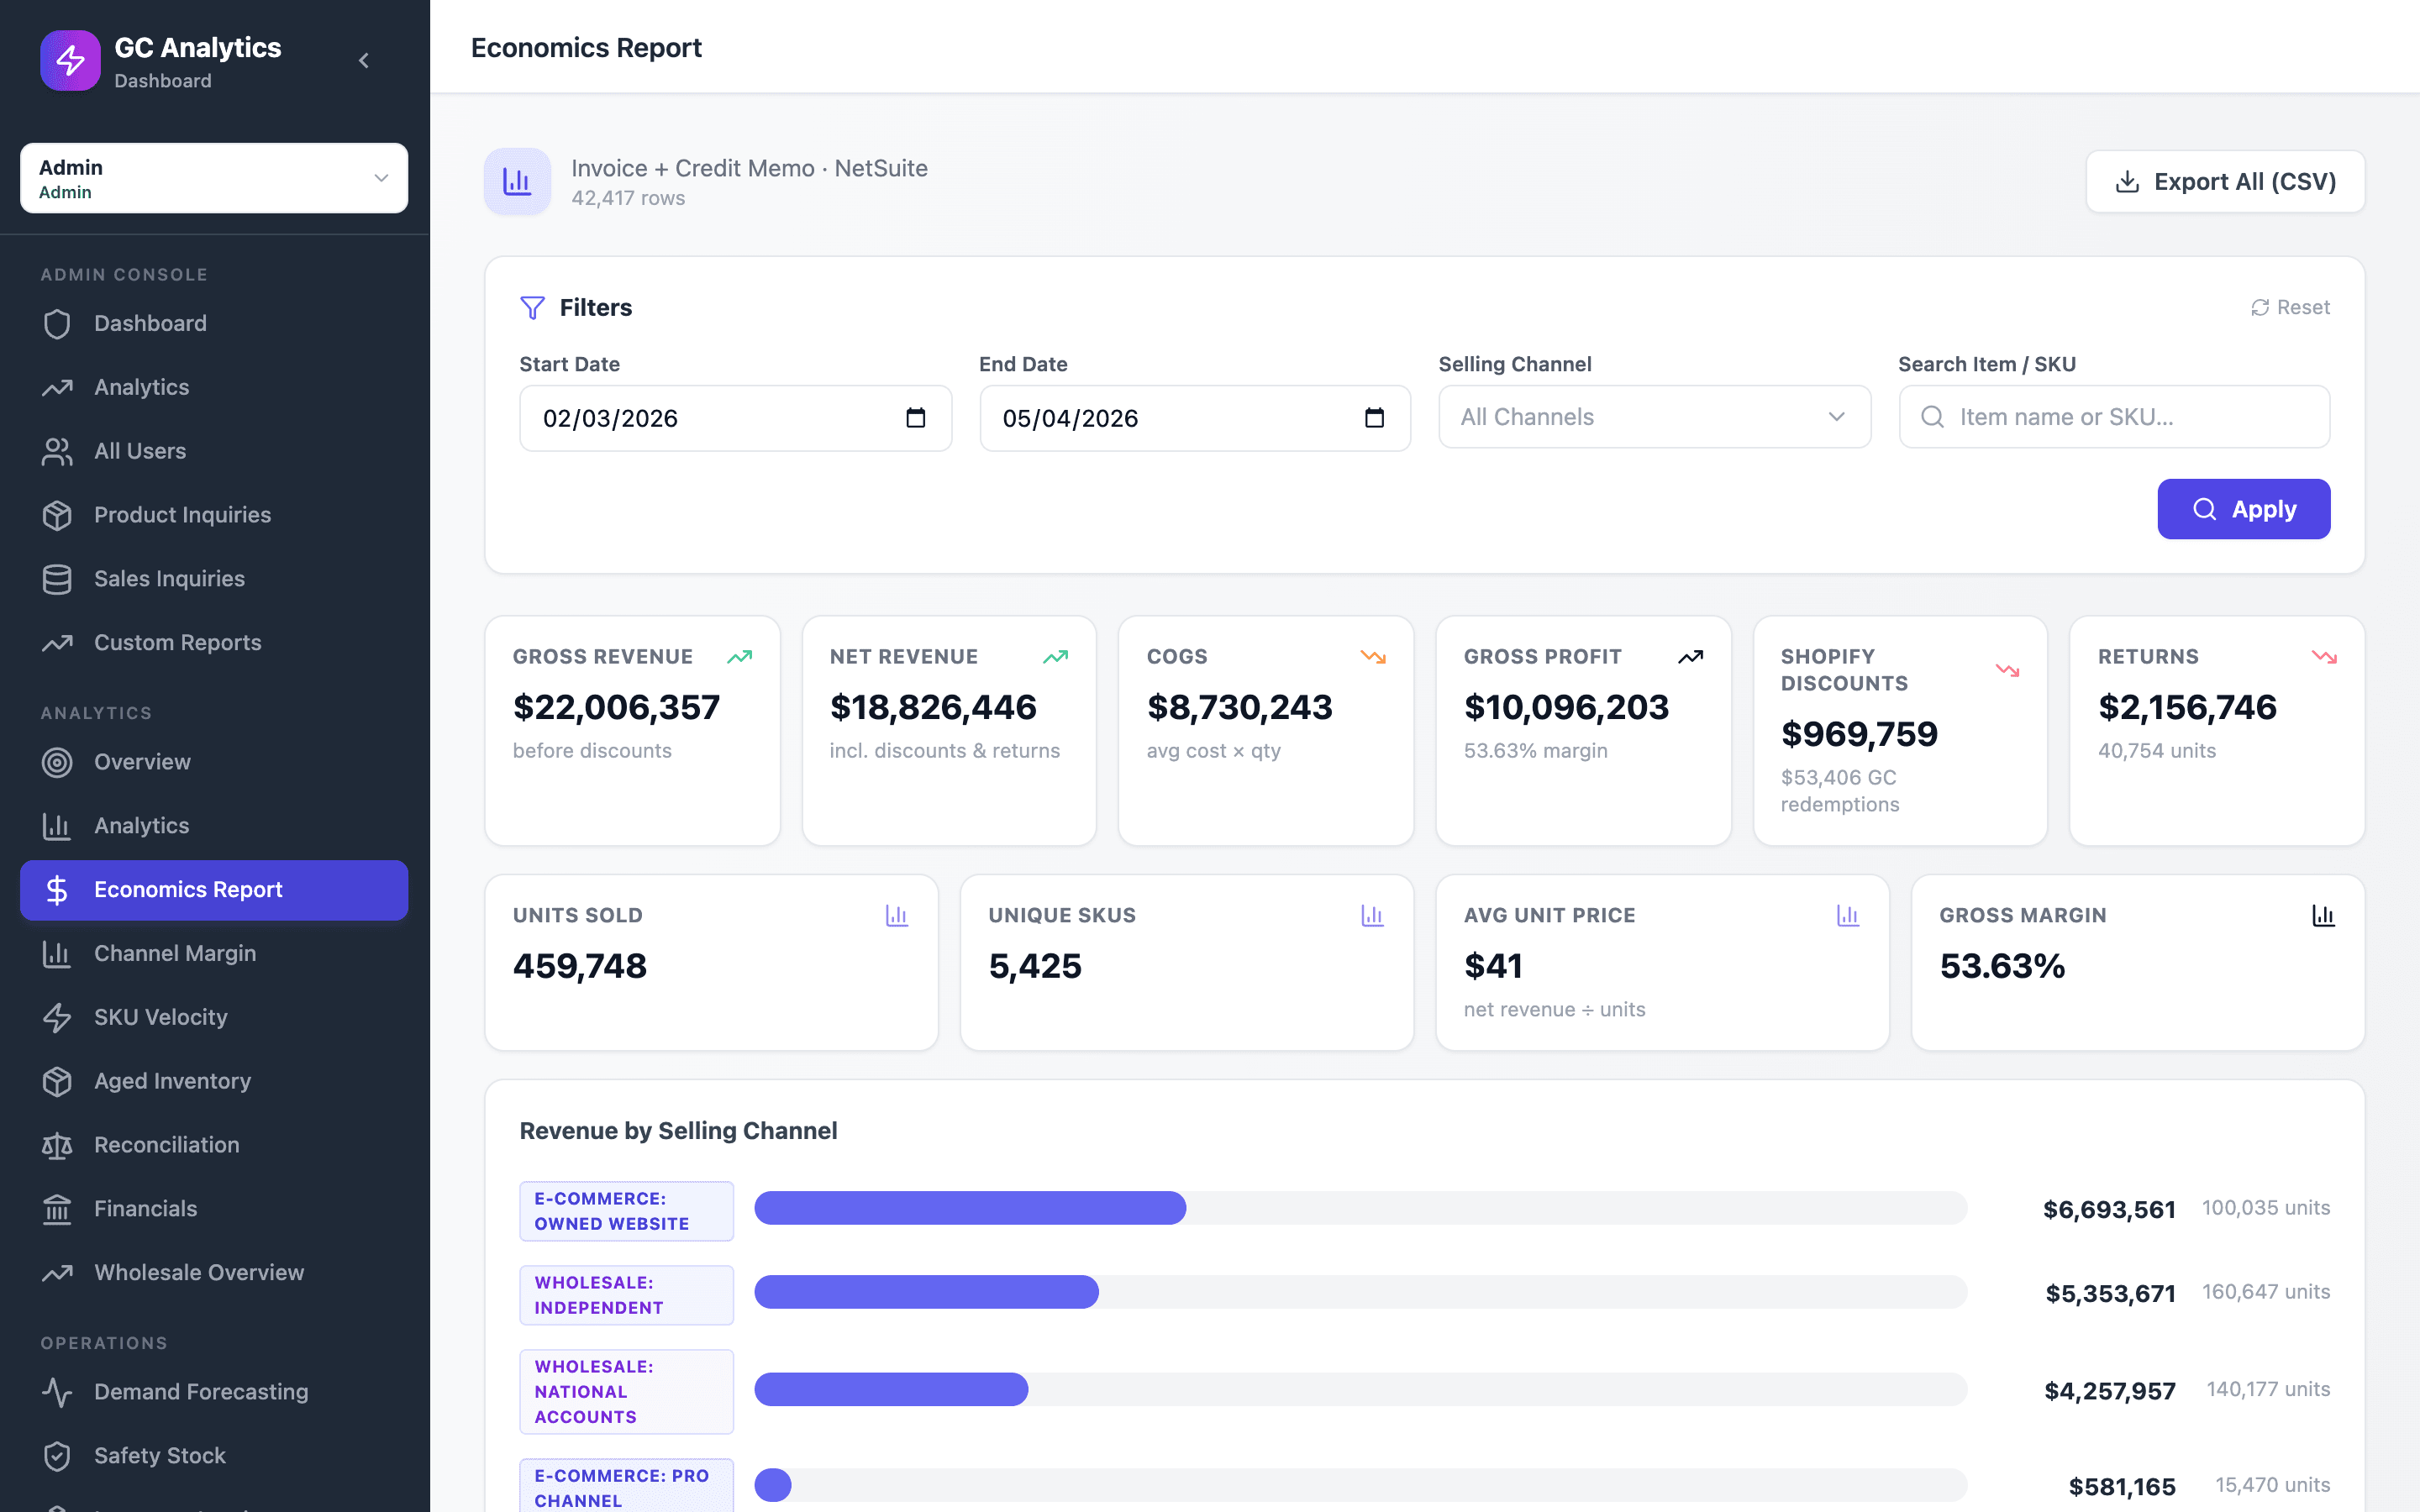
The margin report your finance team has been building manually in Excel
Gross revenue, COGS, net revenue, and margin broken down by SKU and selling channel — the report most NetSuite brands are still rebuilding from exported saved searches every month. Filter by date range, search by item, export to CSV for the close or the board deck.
- Per-SKU and per-channel margin in one report
- Date range and selling channel filters
- CSV export for finance, accounting, or board decks
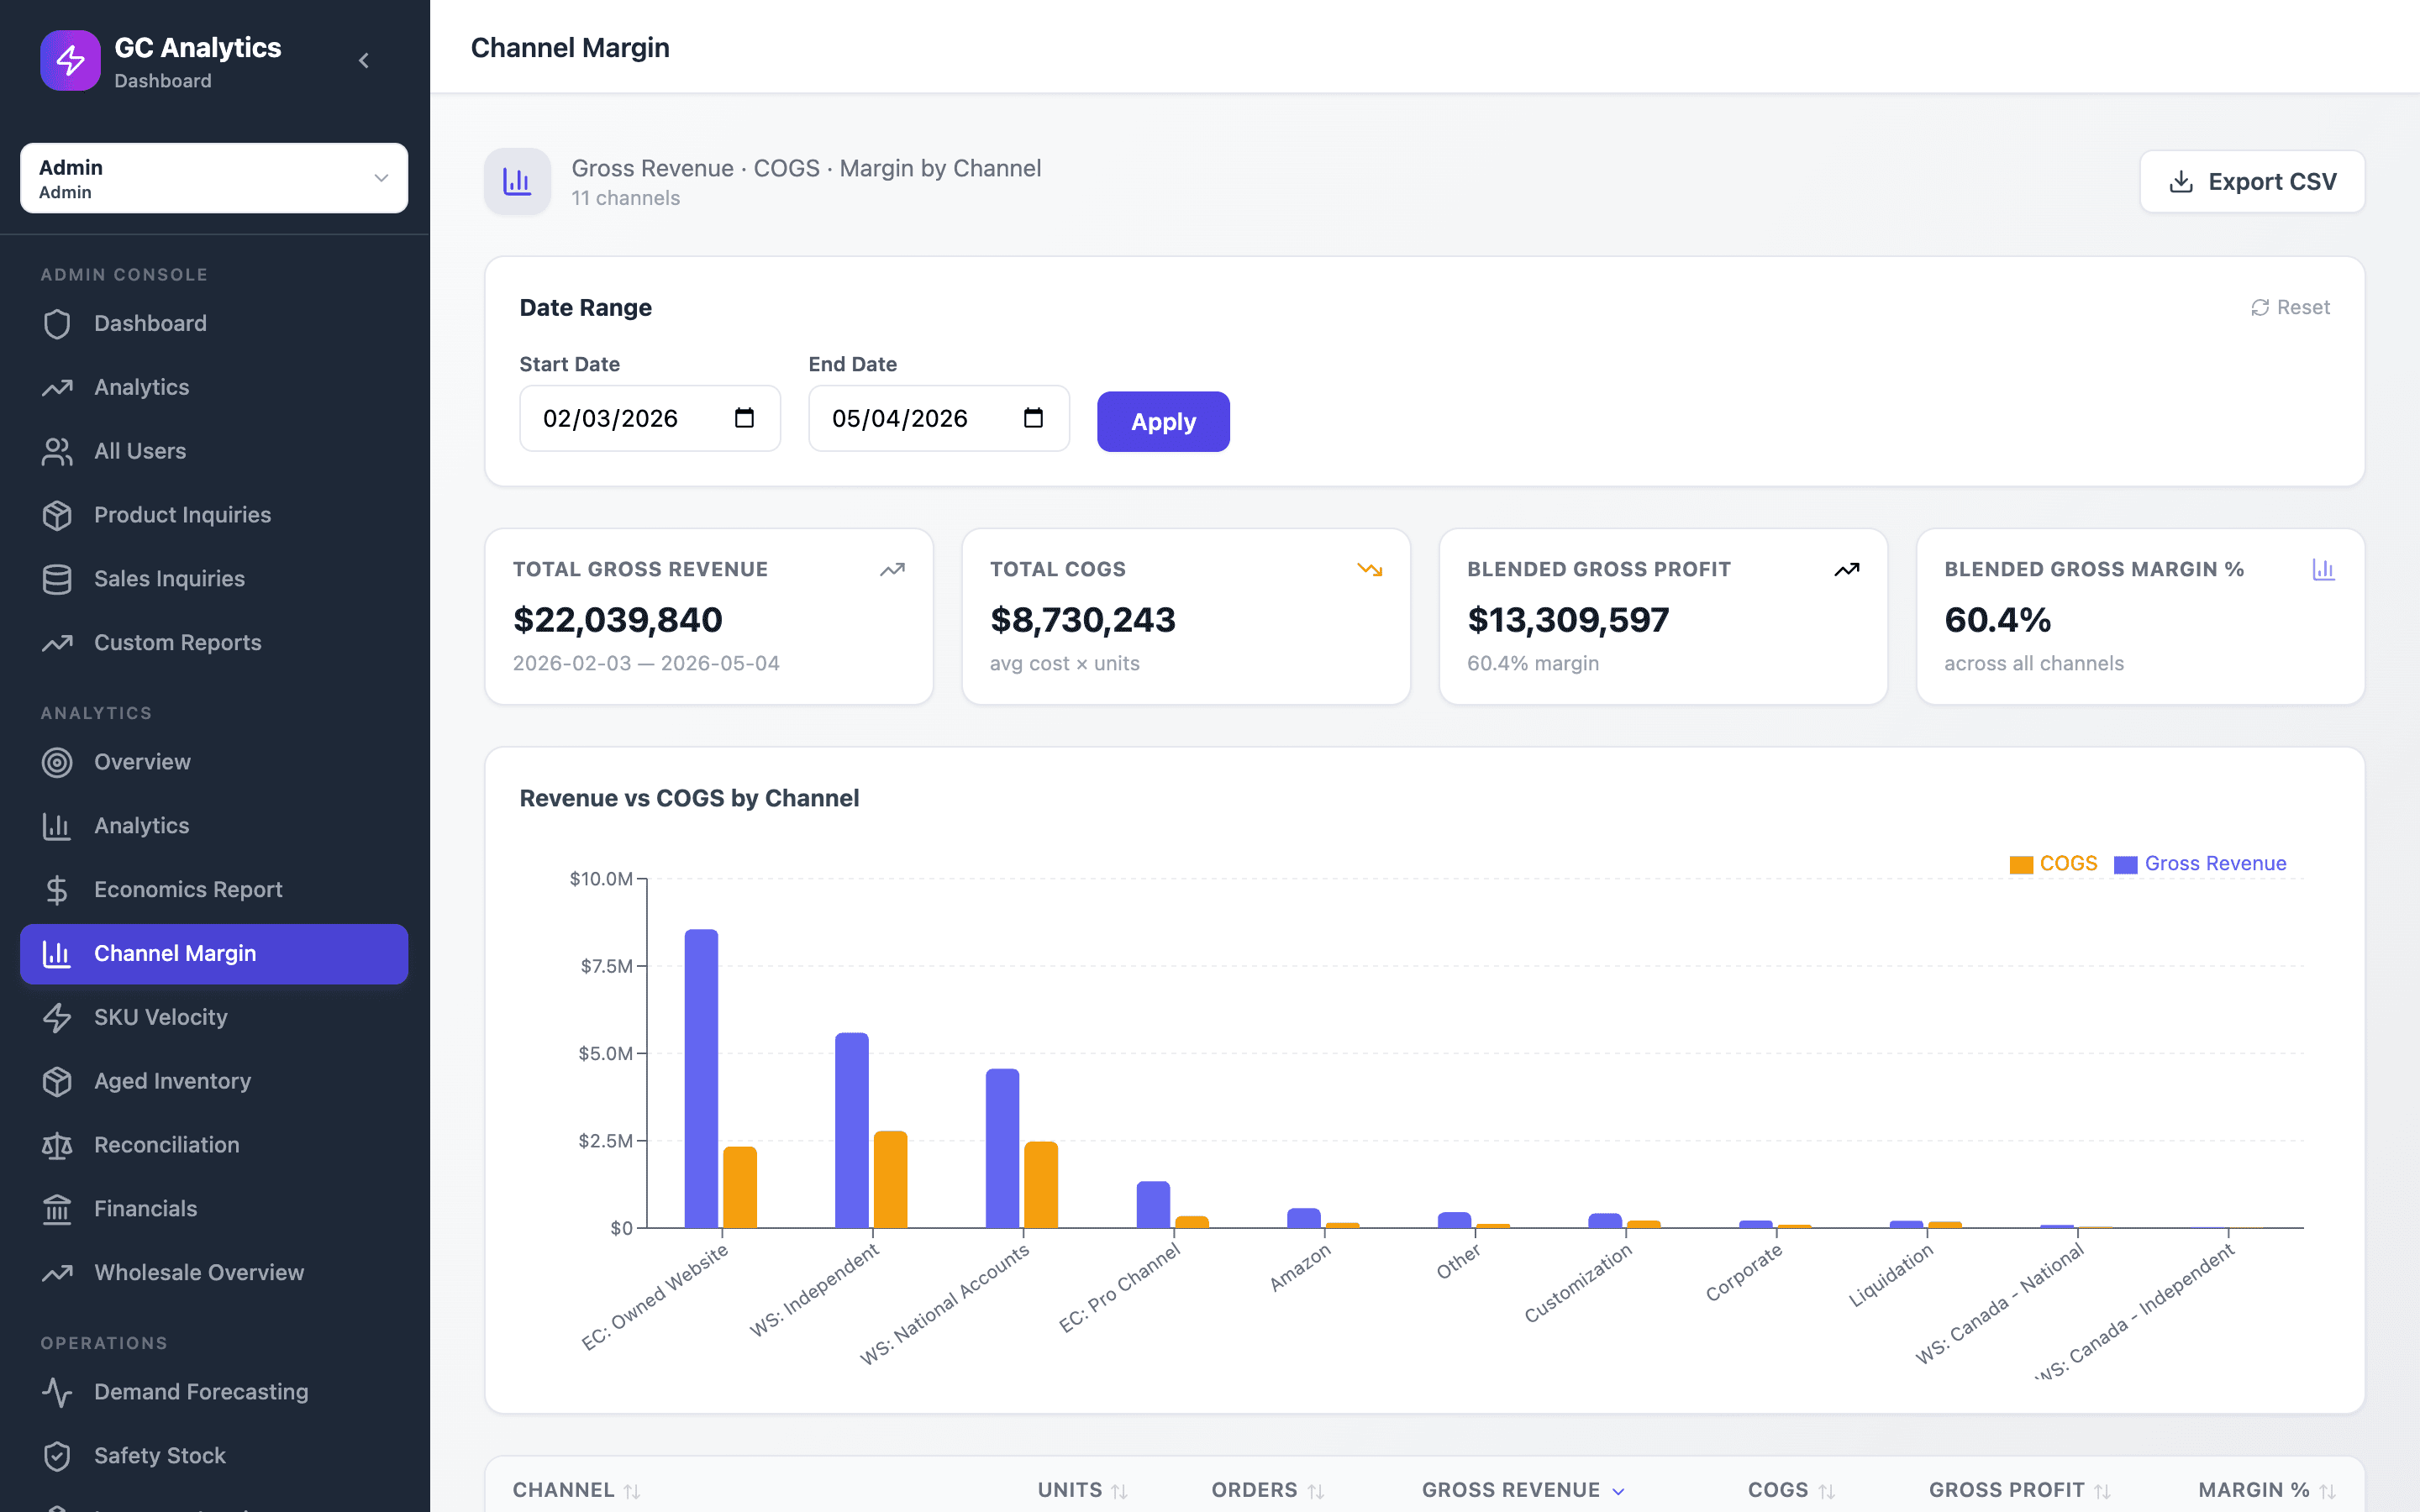
Know exactly where your margin lives
Revenue and COGS side-by-side across every channel you sell through. See which channels are actually making you money and which ones are eating margin, without pulling a single saved search.
- Revenue vs. COGS comparison across all channels
- Blended gross profit and margin percentage
- Per-channel detail table with units, orders, and margin
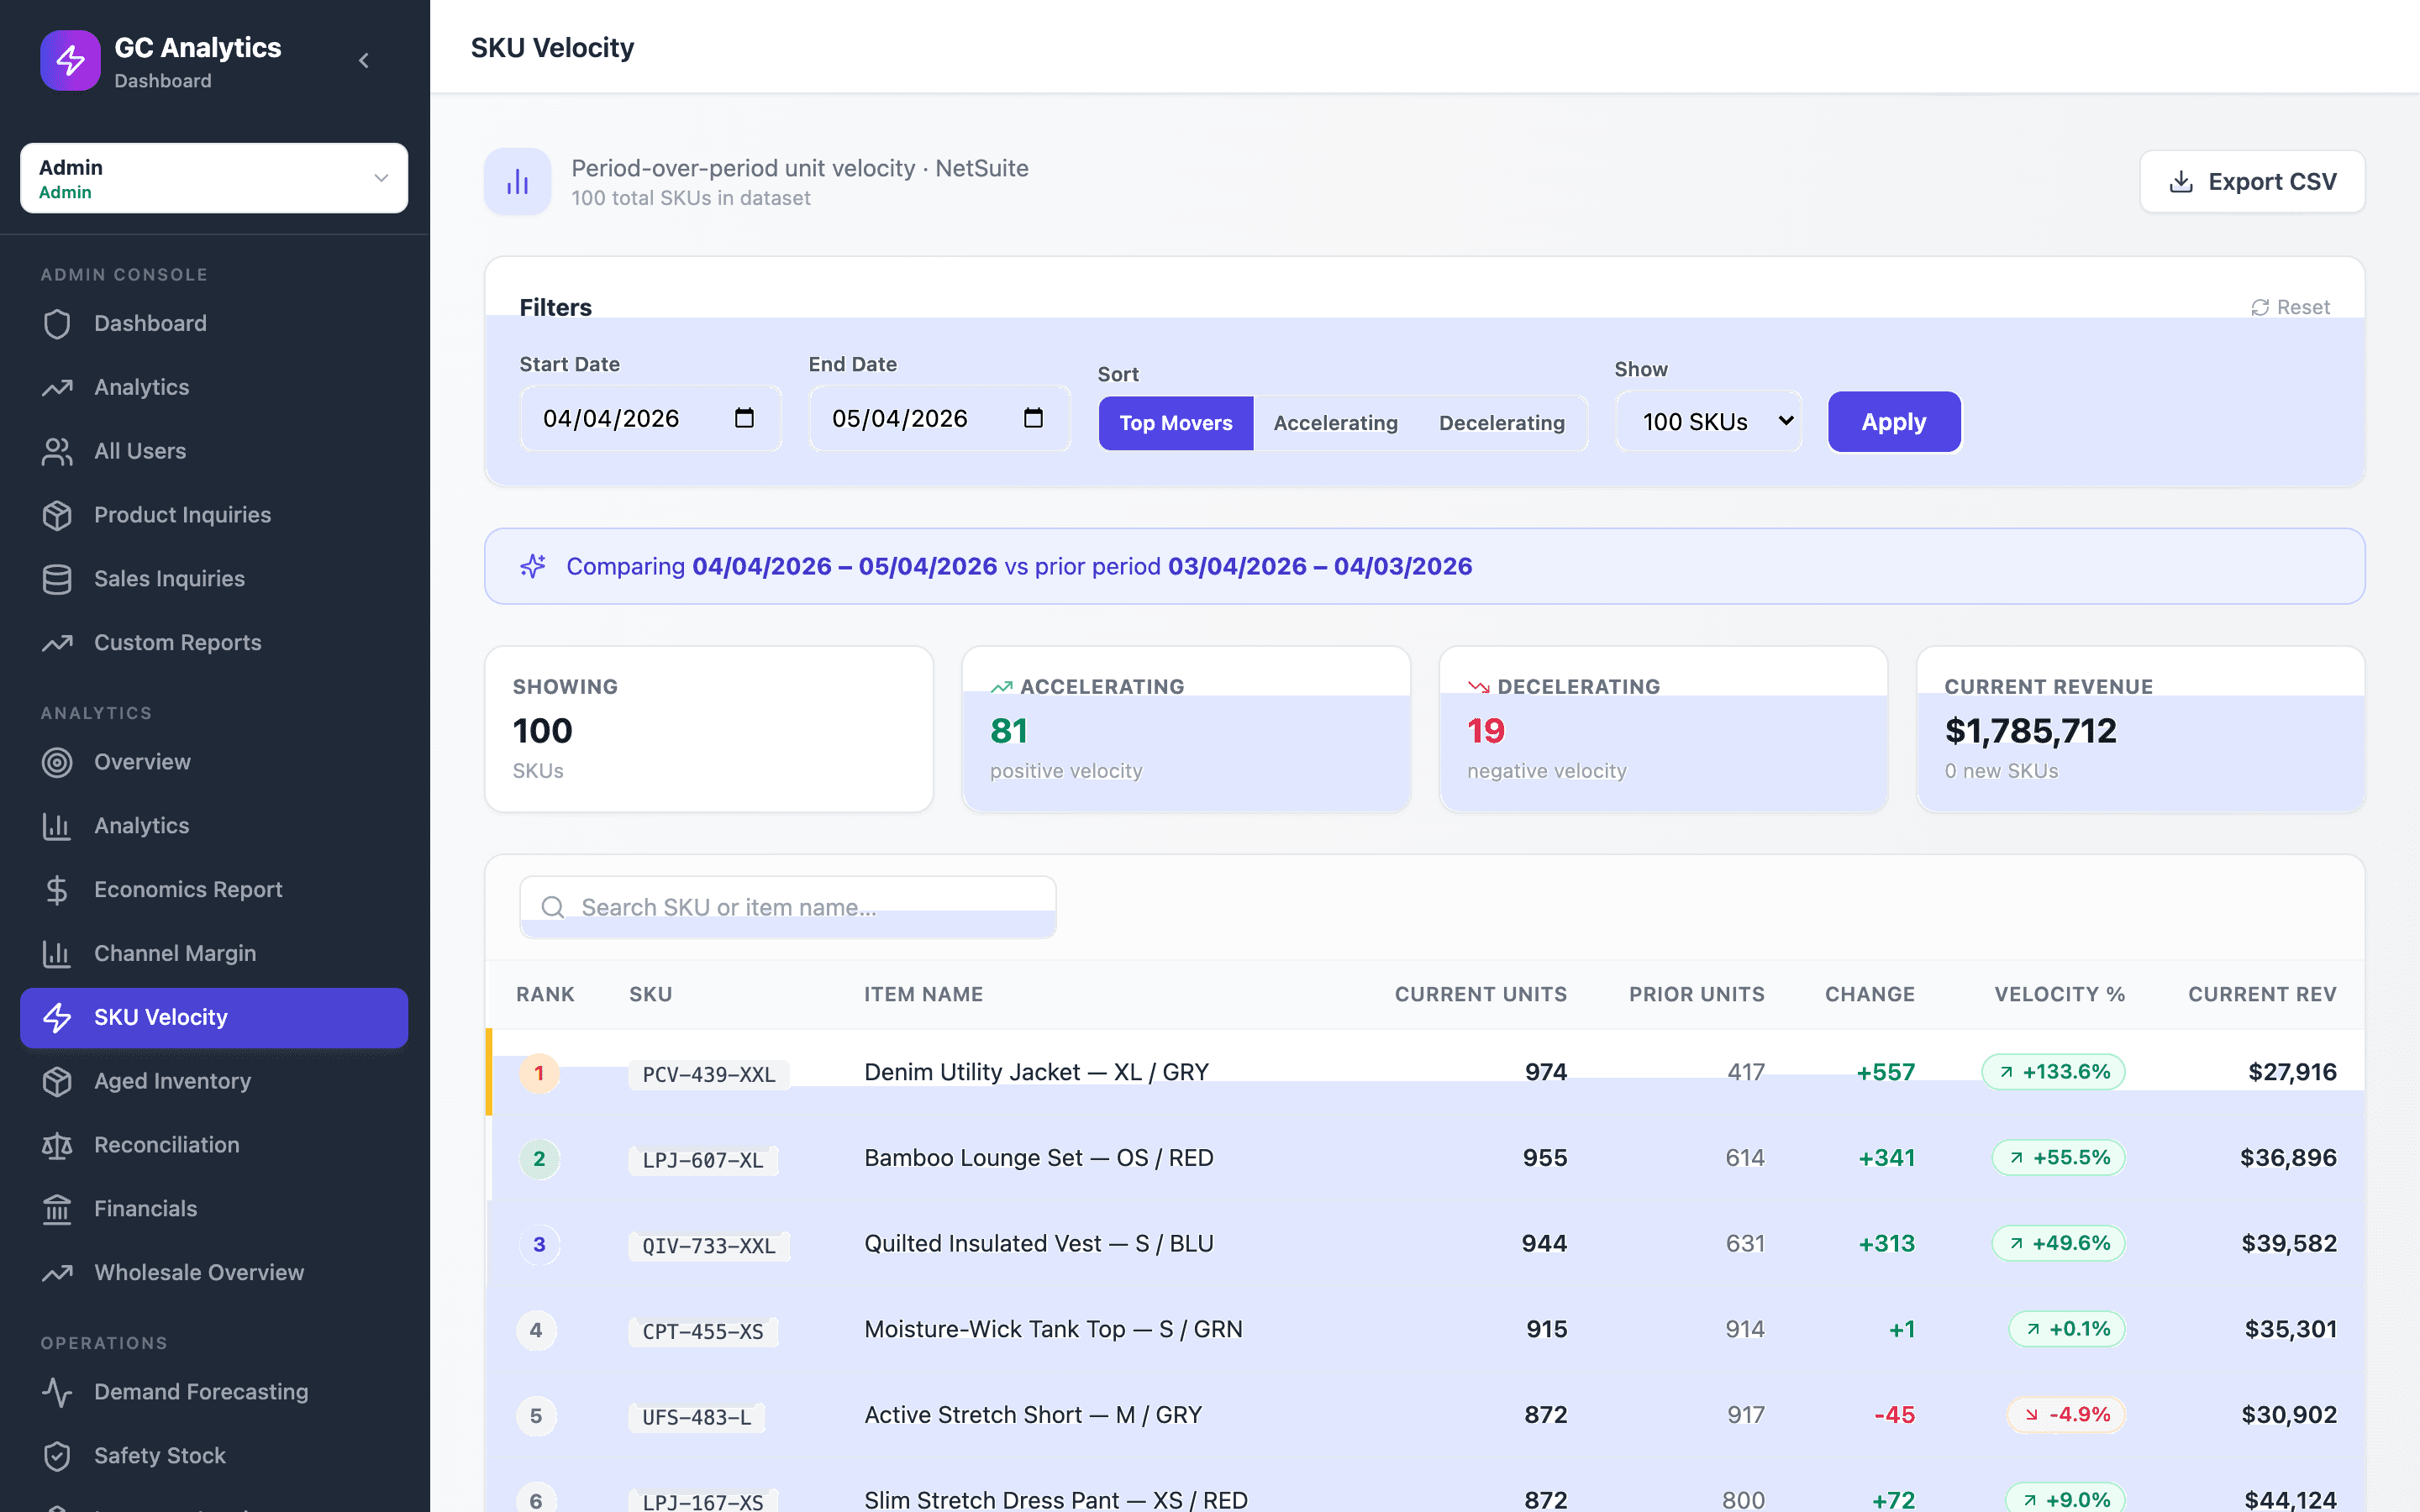
Find your fastest movers, before they sell out
Period-over-period unit sales across your top SKUs, with accelerating and decelerating trends flagged automatically. Know what to reorder and what to promote based on what's actually moving right now — not a saved search you ran last month.
- Compare any two periods at the SKU level
- Automatically tag accelerating vs. decelerating SKUs
- Sort by velocity %, current units, or revenue contribution
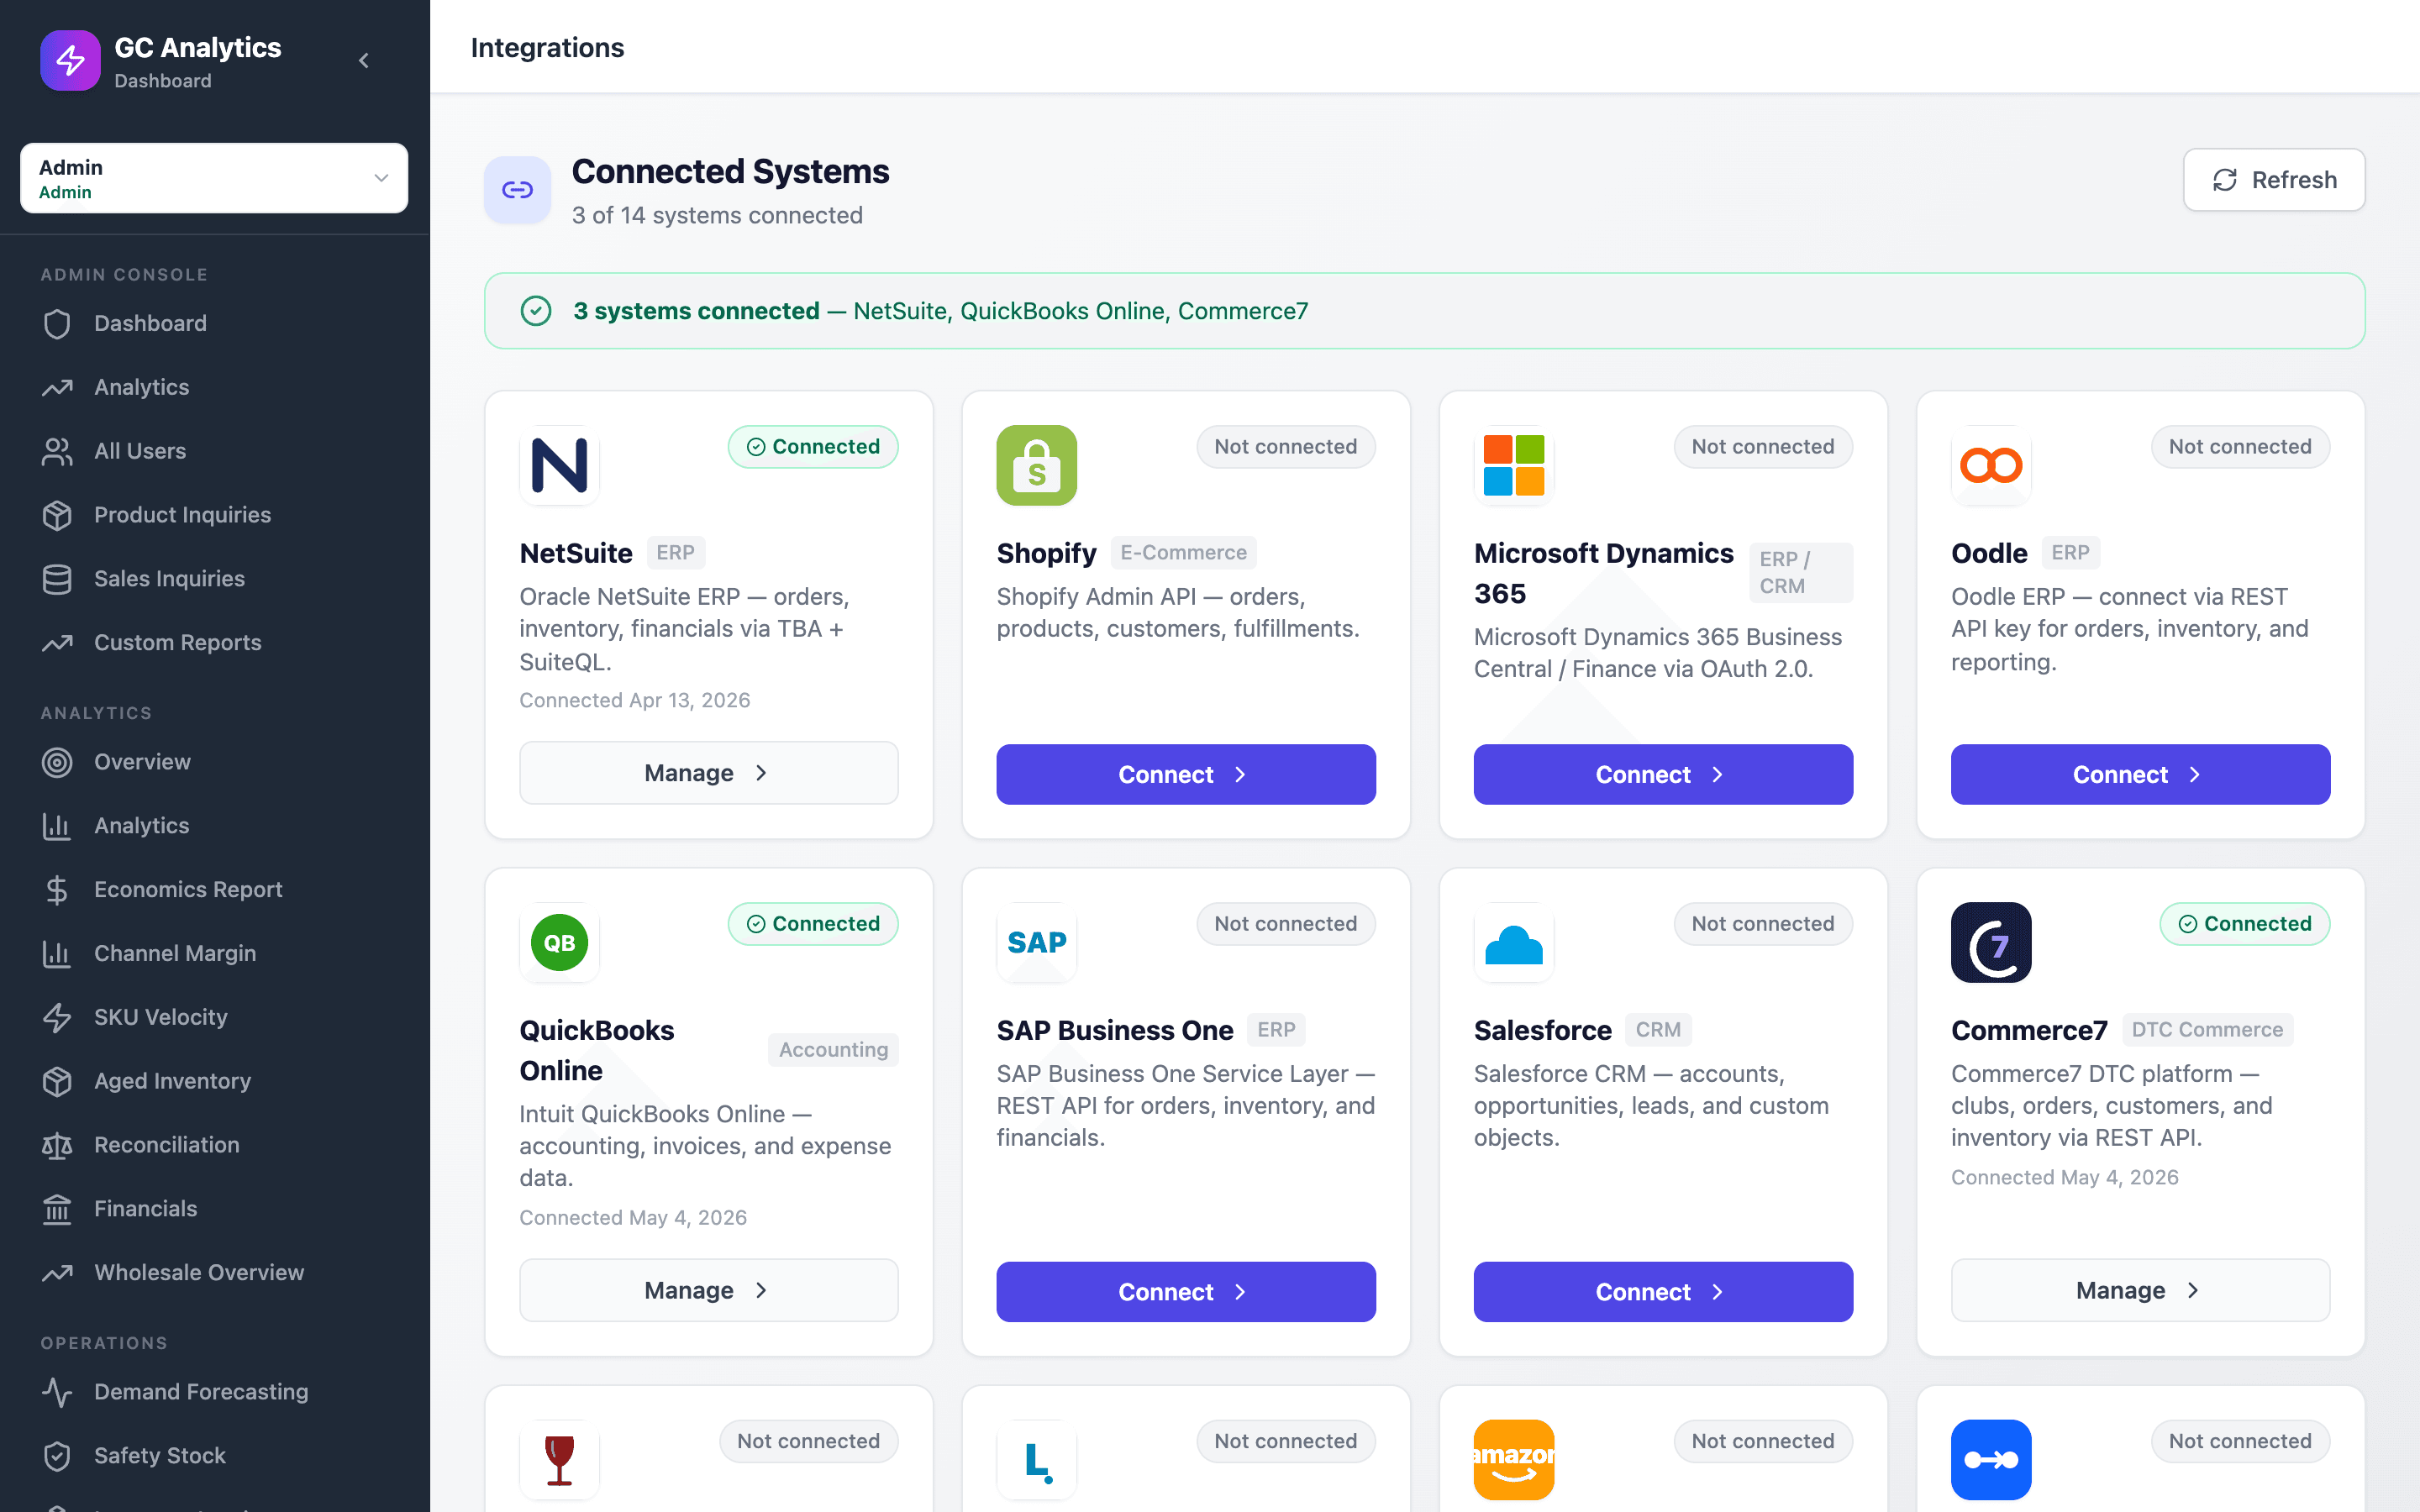
Connects to NetSuite and the rest of your stack out of the box
Pre-built connectors for NetSuite, Microsoft Dynamics 365, SAP Business One, QuickBooks Online, Shopify, Commerce7, Amazon, Linnworks, WineDirect, SPS Commerce, eTail Connectors, Integrate.io, and Salesforce — plus Snowflake, Google BigQuery, Amazon Redshift, and MotherDuck. Additional systems available. No IT tickets, no custom scripting.
- Pre-built connectors across ERP, eCommerce, marketplace, EDI, CRM, and data warehouse
- Centralized credential management and connection status
- Add new systems without IT tickets or custom scripting
Built for NetSuite teams that have outgrown saved searches and spreadsheets
If your team is jumping between systems, exporting CSVs to reconcile data, or waiting on overnight ETLs to answer simple questions, GC Analytics replaces that friction with a single live view your whole team can work from.
Operations
Live fulfillment status, open orders, and reconciliation queues, so you ship on time and catch issues before they become tickets.
Finance
Close-quality revenue, COGS, and margin reporting with channel-level detail. Export to CSV for the close, the board, or the auditors.
Sales
Channel performance, SKU velocity, and customer order history, all without logging into the ERP.
Frequently asked questions
What is GC Analytics?
GC Analytics is a real-time business intelligence dashboard built for NetSuite users. It connects NetSuite and the rest of your stack into a single live view so operations, finance, and sales teams can make decisions without jumping between systems or exporting saved searches.
Which ERPs and systems does GC Analytics integrate with?
GC Analytics has pre-built connectors for NetSuite, Microsoft Dynamics 365, SAP Business One, and QuickBooks Online on the ERP side; Shopify, Commerce7, Amazon, Linnworks, and WineDirect on the commerce and marketplace side; plus Salesforce on the CRM side. It also connects to Snowflake, Google BigQuery, Amazon Redshift, and MotherDuck. Additional sources are available on request.
Does GC Analytics work with Shopify, Amazon, Commerce7, and other commerce platforms?
Yes. Shopify, Commerce7, Amazon, Linnworks, and WineDirect are all supported in Order Sync and Reconciliation today. Additional ecommerce and marketplace channels are available on request.
Can GC Analytics connect to my data warehouse?
Yes. GC Analytics connects to Snowflake, Google BigQuery, Amazon Redshift, and MotherDuck, so you can layer real-time reporting on top of your existing data infrastructure without rebuilding pipelines.
How is GC Analytics different from a generic BI tool?
Generic BI tools like Tableau or Power BI give you a blank canvas and a long implementation. GC Analytics ships with ERP-aware reports, multi-channel reconciliation, and integrations purpose-built for NetSuite, commerce, and warehouse data — so you get value on day one.
Who is GC Analytics built for?
Any NetSuite user whose team is spending more time wrangling spreadsheets and refreshing saved searches than making decisions. We see it most often with product-based businesses across apparel, beverage, wholesale, food, hardgoods, and DTC, but the platform works for any company that needs faster, cleaner reporting on top of NetSuite. Operations, finance, and sales teams use GC Analytics daily to work from a single live source of truth.
How long does implementation take?
Timelines depend on the systems involved and the state of your underlying data. Every engagement is scoped upfront so you have a realistic plan before kickoff, and rollouts are phased so your team starts seeing value as soon as the first integrations are live.
How do I get started?
Request a demo and we will walk you through the platform with your stack in mind, then propose a scoped rollout plan tailored to your systems.
See what your NetSuite data actually looks like in GC Analytics
Request a demo and we will walk you through the platform using reports that match your actual stack — NetSuite, Shopify, your channels. No generic slideware. Implementation is scoped upfront so you know what you are getting into before you commit.